
What is the quickest way to find out about the current condition of a company? One of the best ways is to take on our flow glasses and follow how work really happens, which can be illustrated through a value stream map.
“The maturity of an organization is measured by the speed at which it can reliably and repeatedly execute its core processes.”
– Mary Poppendiek
Extracting a value stream map is an essential tool in the Lean/Agile leader’s toolbox.
A value stream map is a unique opportunity for participants engaged in projects to overview the full journey from start to finish to see what really happened.
I will share how to run a value stream map remotely and how to run it on location.
What can you read from a value stream map?
Let’s take a look at a value stream map and what can be read from it. First, let’s illustrate with a very simple value stream map:
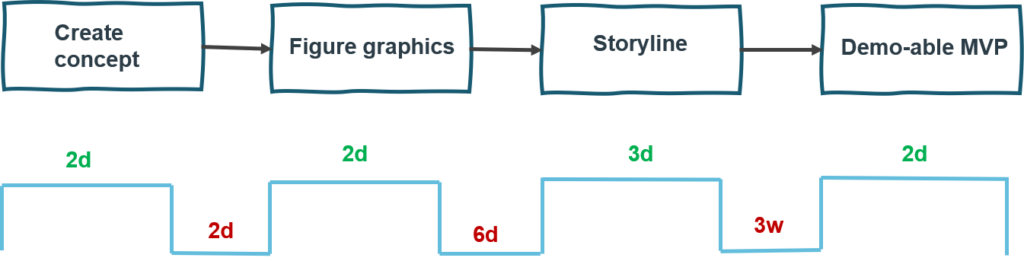
What can we read from this? Let’s highlight a few areas:
- Where do we have bottlenecks? It is generally fairly easy to identify bottlenecks in a value stream. Queues often form in front of bottlenecks which aggravates wait time. In this example there is a long wait time between Storyline and Demo-able MVP.
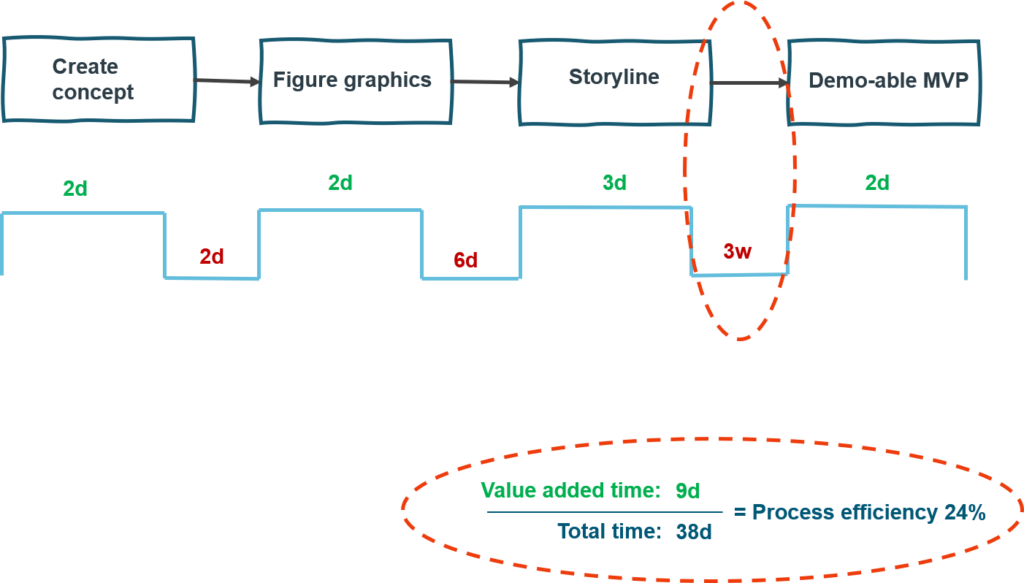
- Lead time. By adding the total time, we can derive the lead time: in this case, the lead time is 38 days.
- How fast could we have delivered this optimally? This is one of the most important insights. In this case, if we had run the process optimally, we could have delivered this in just 9 days.
- Process efficiency. Aka the relationship between Value-added time and Total time (lead time). As a rule of thumb, it is generally rare for a randomly picked process that hasn’t been continuously improved in product development to have a process efficiency above 20%. The normal case is often in the range of 15-20%. Process efficiency gives a hint as to how much you could improve, in this case, by a factor of 4.
A value stream map layout for product development
I’ve been using value stream maps for over 10 years to find the key areas of improvement. I’ve run value stream maps in a range of contexts: digital marketing, software, hardware. This is by far my favorite layout. I’ve learned that this brings up good questions, insights and conversations.
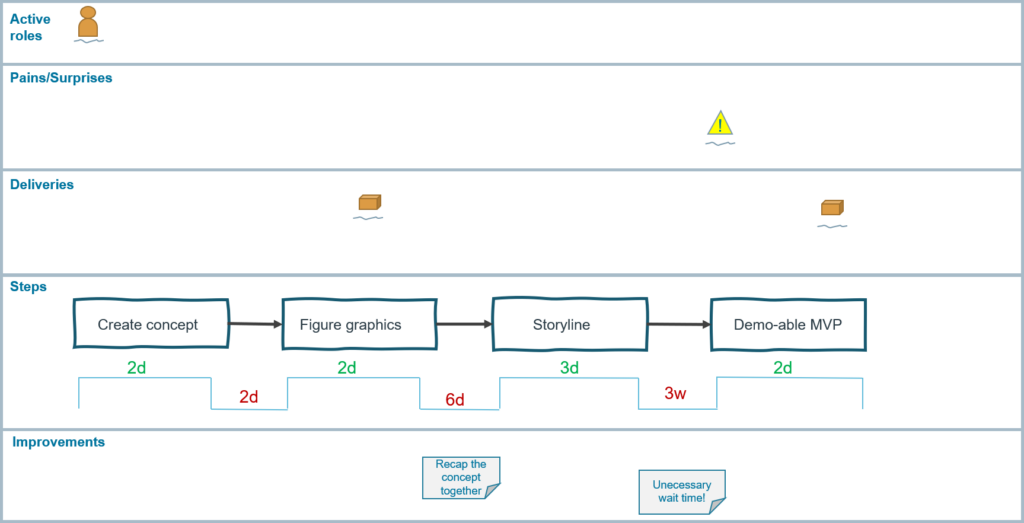
Lanes from the top:
- Active roles: Roles active during this phase
- Pains/Surprises: The pains/surprises/WTF moments (yes, every project has them! If you, for some strange reason, don’t find any, then you simply aren’t innovating…)
- Deliveries: The deliveries that happened during the course of the project
- Steps: What actually happened
- Improvements: The key part, what we would like to do better next time.
Feel free to adapt the layout to suit your situation.
Setting up the value stream workshop
To run the workshop, you need a cross section of people who together can tell the story from start to finish. You will need a group of somewhere between 5 to 15 people.
Time to run the workshop is roughly 2.5 hours, so reserve a morning or an afternoon for the workshop.
Then, you need to pick a project to run the value stream map on. You should be looking at a project which has been completed (or at the very least, very close to completion) so you can rebuild the journey from start to finish. Pick a project that you want to learn from.
On location: Find a room with plenty of space and most importantly, one big wall. On the wall, add plastic material or cardboard paper (similar to material you would use when protecting surfaces when painting or refurnishing). You need a rectangle of 2m (height) by 4m (width).
Additional material required: Post-its (large ones for steps, small ones for roles/pains/improvements), Sharpies.
Remote: Use Teams/Zoom together with an online whiteboard, for example Miro or Mural. Feel free to use the Miro template here .
Running the workshop
The agenda
- Welcome and introduction
- What we are here to create – A small overview example of a value stream map
- (this helps the group visualize why we are here and the end result)
- Do the value stream walk!
Running the value stream – Facilitator’s guide
I highly recommend using a physical token such as a pen, a juggle ball or an item from the project itself, which is passed between the participants as a baton, just as handovers were made in the real project. The physical token is your “mic” and designates whose turn it is to speak.
Even in scenarios where I have run the workshop online, I introduce the token as a concept. This helps to direct the group’s attention to whose turn it is really to speak.
Walk the steps
- “What is the name of this step”
- “Ok so what was the activity that took place here?”
Often when people retell this step, they start to remember, so be careful not to interrupt their flow when they do. As a facilitator, in the background, mark down roles that were engaged at this phase, if deliveries were made and if any surprises/pain points emerged. Then follow up where clarity is needed by asking back “just checking that I got this right…“ and fill in the missing details.
- “(Fill in missing details). Were there surprises/pain points? Deliveries made?” “Which roles were engaged at this phase?”
- “What was the active time you spent on this?” (if it turns out that it was a combination of “active” and “waiting to complete the step”, I mark it using green and red (3d + 4d).
- “What was the next step?” Did it start directly after the previous one or was there wait time in between? (mark it down)
Repeat until completion of the project.
Improving the flow
This is the most important step, in a nutshell, the main reason we are all here.
In this step, invite the group to walk the value stream, then take a step back, and suggest improvements they would like to see. Write down each improvement on a post-it. Invite the group members to volunteer to make at least one improvement happen.
It is key that the improvement responsibility resides with the people who will be active when the next project happens.
Download the templates
- For on location sessions: Download a pdf 4_3 template / pdf long template .
- For remote sessions: Download a Miro template.
Happy value stream mapping!